anti alpha smooth muscle actin α sma mouse monoclonal antibody (Boster Bio)
93
Structured Review
Boster Bio
anti alpha smooth muscle actin α sma mouse monoclonal antibody
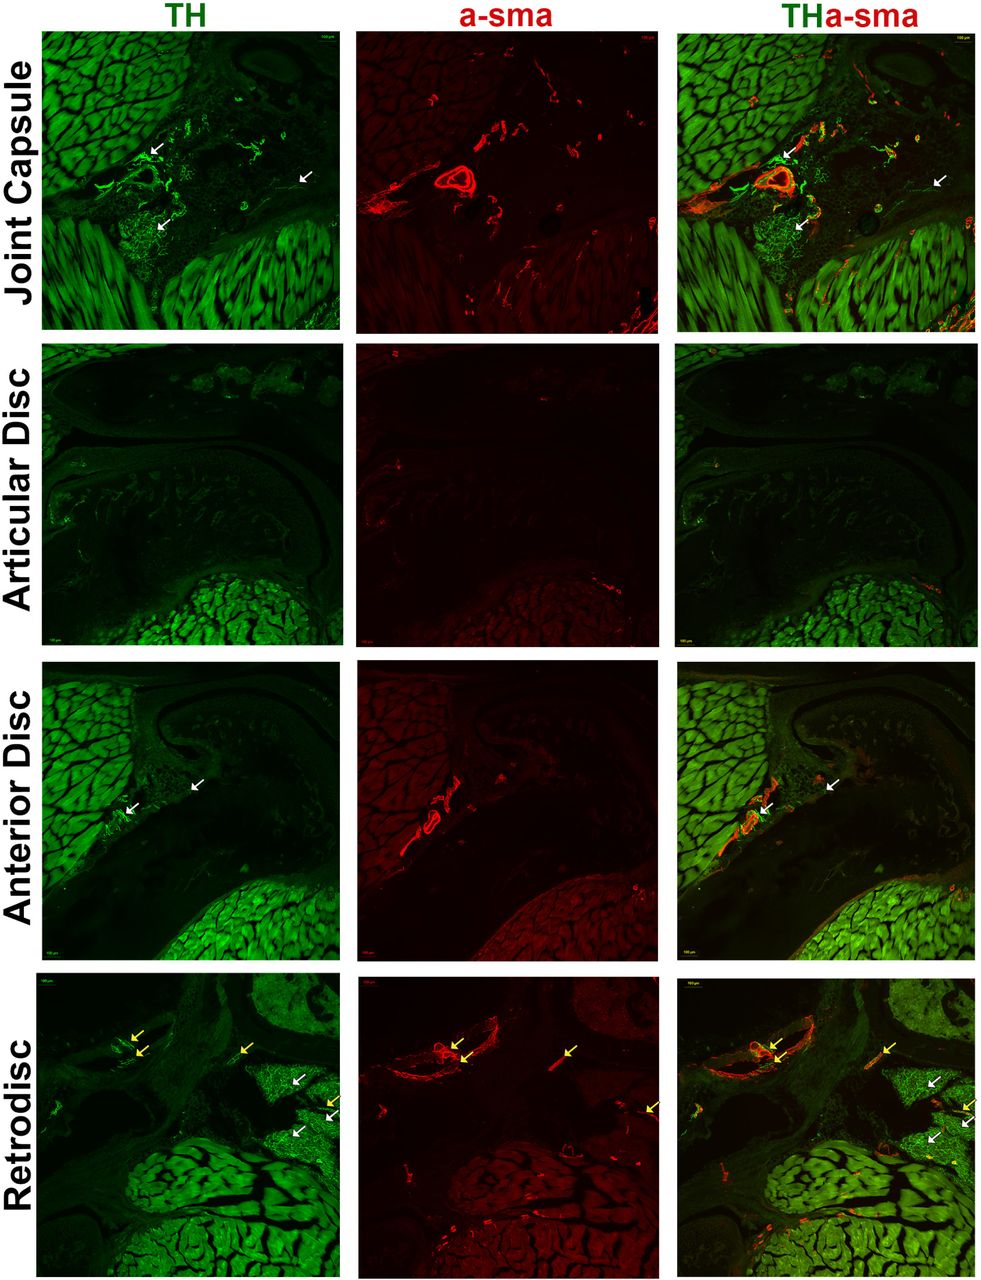
Anti Alpha Smooth Muscle Actin α Sma Mouse Monoclonal Antibody, supplied by Boster Bio, used in various techniques. Bioz Stars score: 93/100, based on 112 PubMed citations. ZERO BIAS - scores, article reviews, protocol conditions and more
https://www.bioz.com/result/anti alpha smooth muscle actin α sma mouse monoclonal antibody/product/Boster Bio
Average 93 stars, based on 112 article reviews
anti alpha smooth muscle actin α sma mouse monoclonal antibody - by Bioz Stars,
2026-02
93/100 stars